AWS Lambda Node.JS Quick Start
Learn how to set up highlight.io on AWS Lambda.
Configure client-side Highlight. (optional)
If you're using Highlight on the frontend for your application, make sure you've initialized it correctly and followed the fullstack mapping guide.
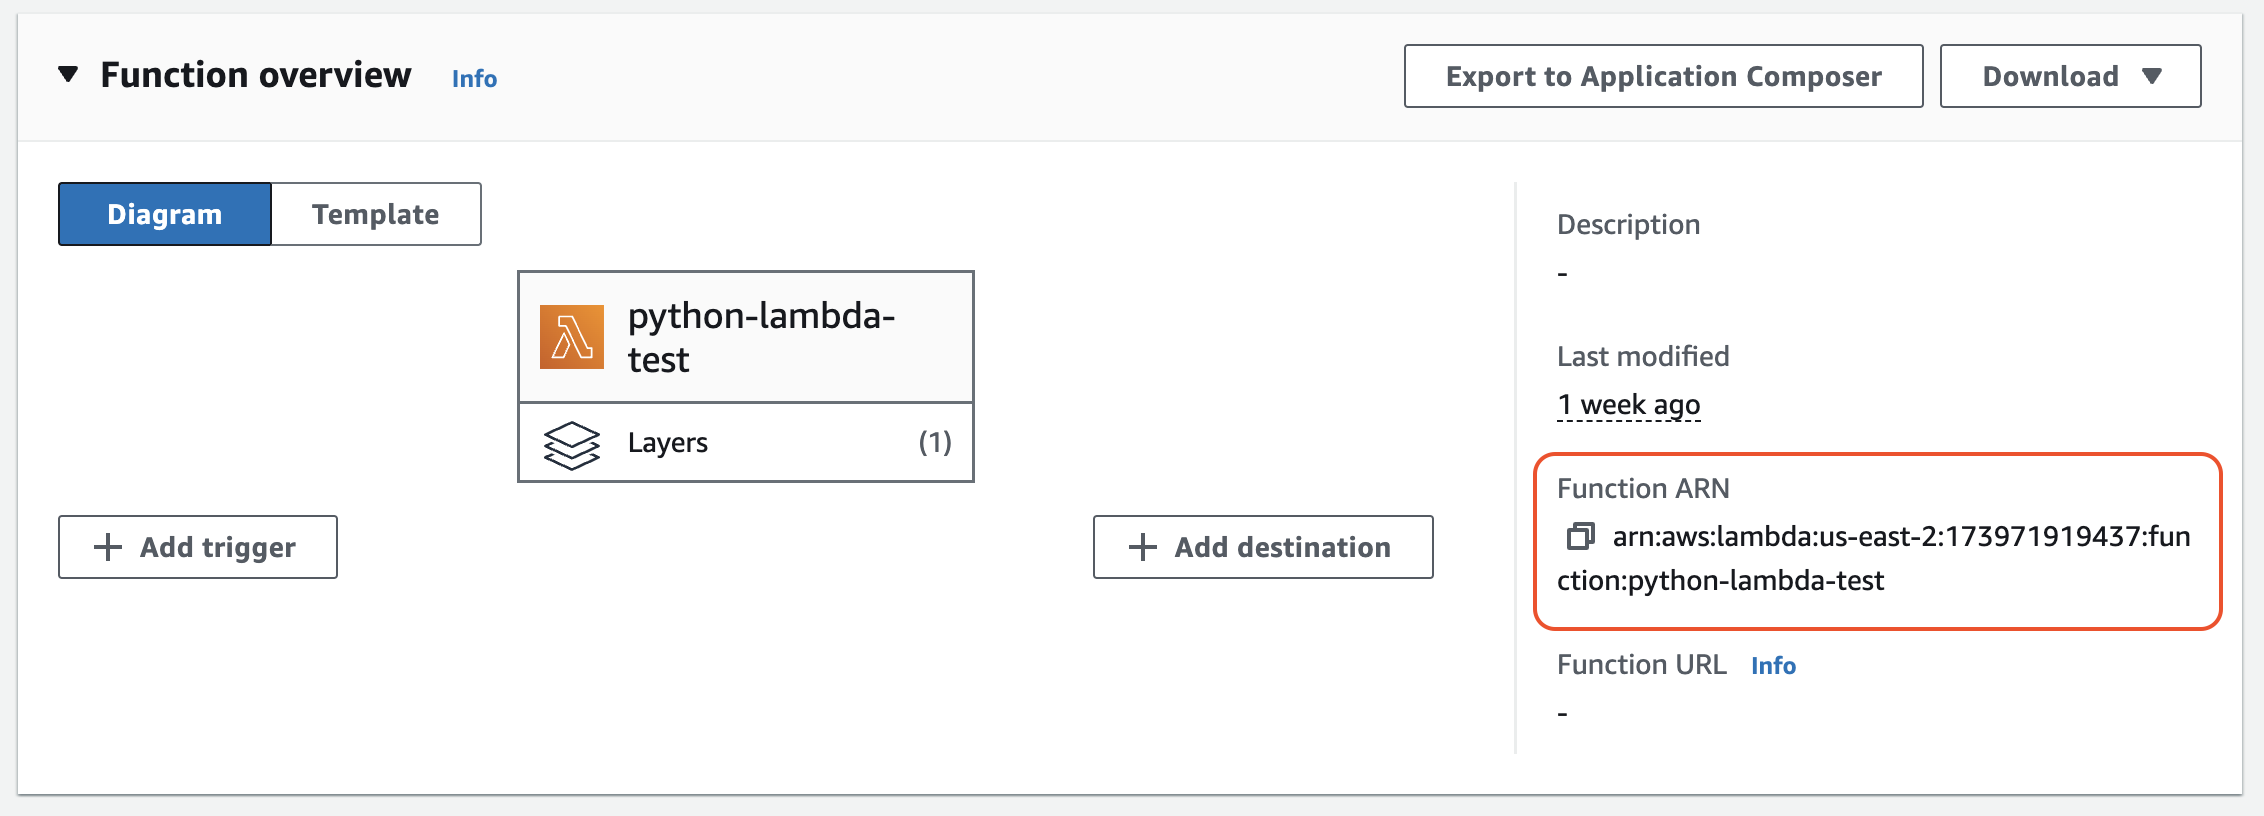
Add the ARN layer.
Add the ARN layer to your Lambda function. Click on the "Layers" tab in the Lambda console and click "Add layer". You can find the most recent instrumentation release URLs in their releases.

arn:aws:lambda:<region>:184161586896:layer:opentelemetry-<language>-<version>Set the ENV vars.
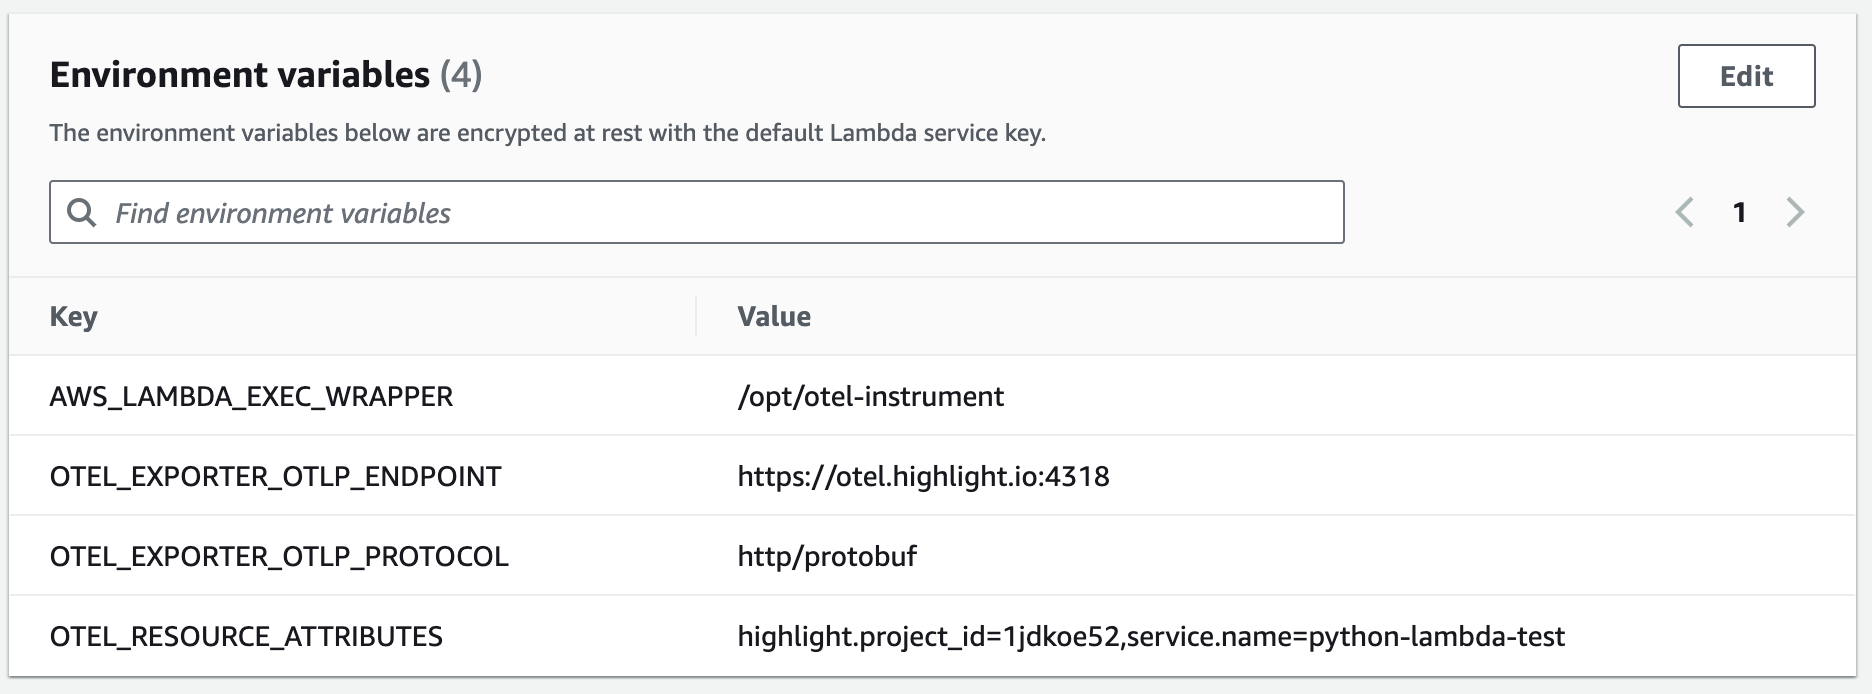
Set the ENV vars to connect your Lambda to Highlight. For more details on setting up the OTeL Lambda autoinstrumentation and some language-specific details, see their documentation.

AWS_LAMBDA_EXEC_WRAPPER=/opt/otel-instrument
OTEL_EXPORTER_OTLP_ENDPOINT=https://otel.highlight.io:4318
OTEL_RESOURCE_ATTRIBUTES=highlight.project_id=<project_id>,service.name=<service_name>Test your Lambda function.
Hit your Lambda function by testing it from the AWS console or sending an HTTP request to it.
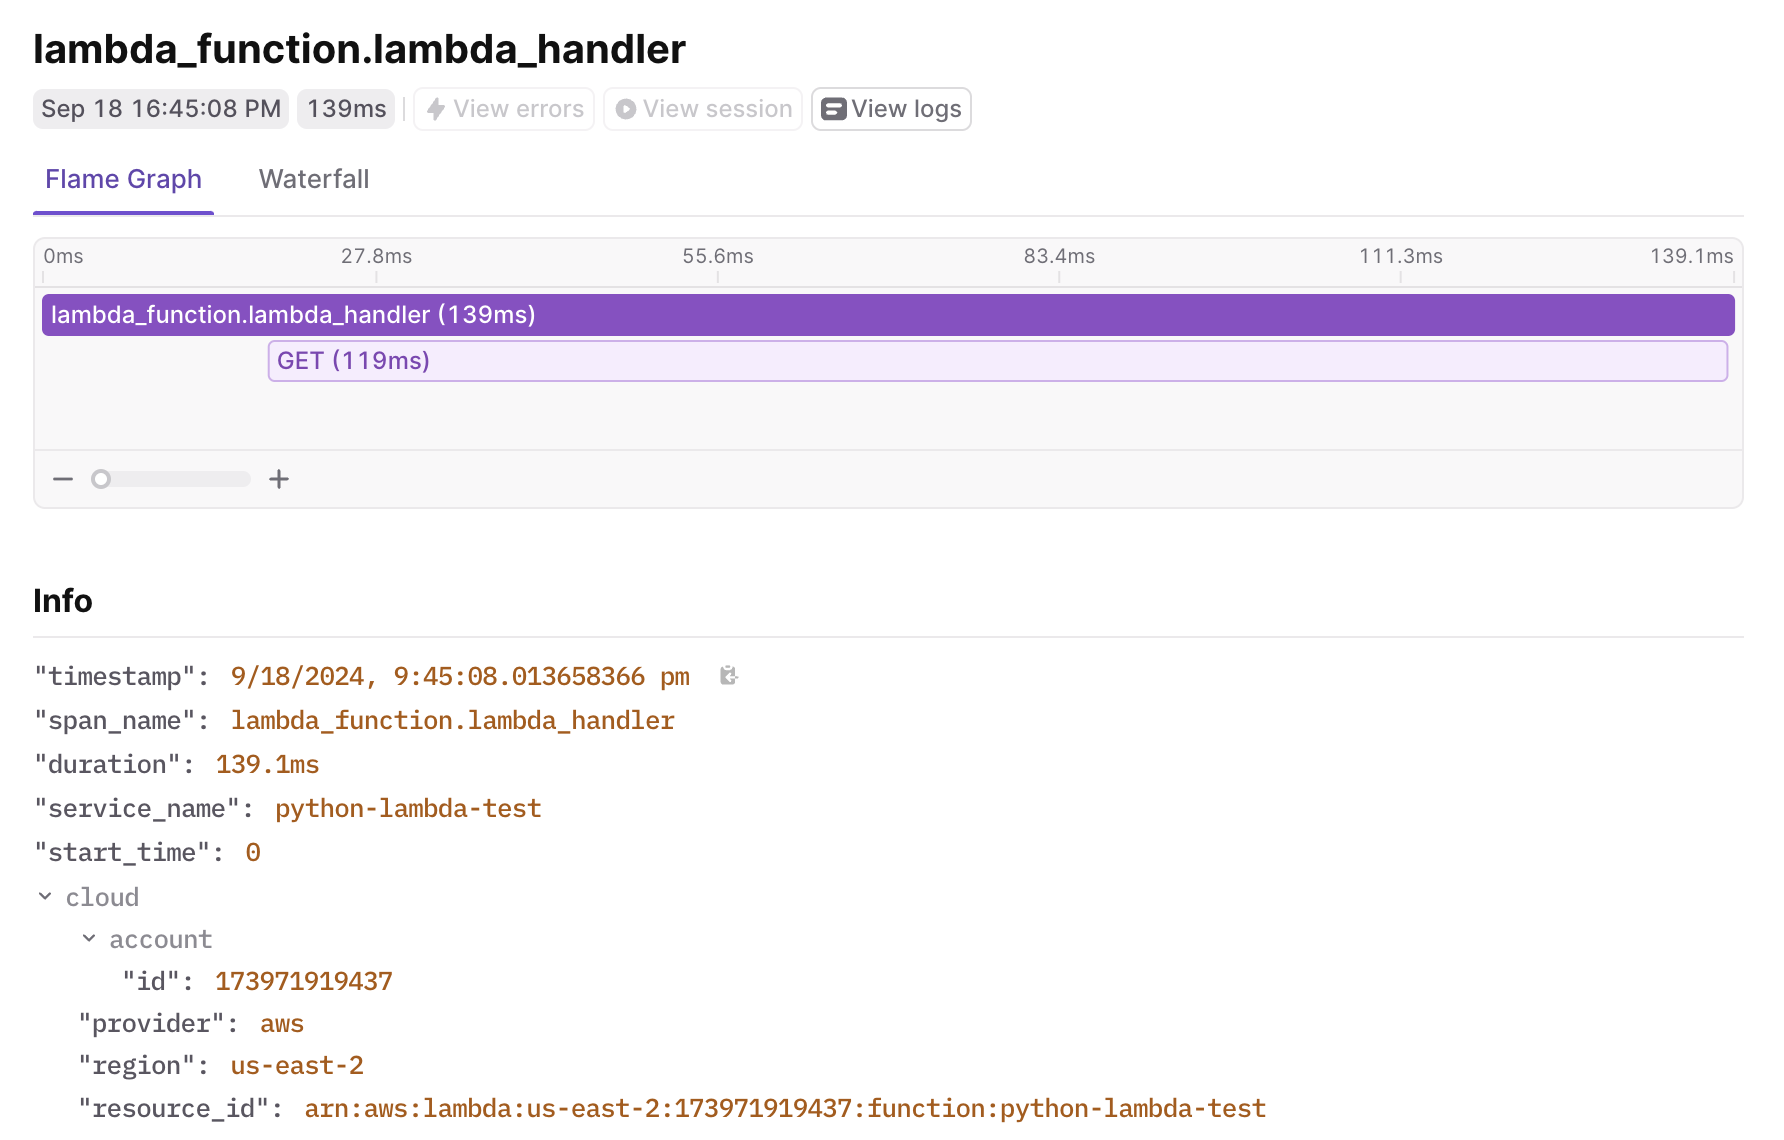
Verify your backend traces are being recorded.
Visit the highlight traces portal and check that backend traces are coming in. 
Install the relevant Highlight SDK(s).
Install @highlight-run/node with your package manager.
npm install --save @highlight-run/nodeInitialize the Highlight JS SDK.
Initialize the Highlight JS SDK with your project ID.
import { H } from '@highlight-run/node'

H.init({
	projectID: '<YOUR_PROJECT_ID>',
	serviceName: '<YOUR_SERVICE_NAME>',
	environment: 'production',
})Add the AWS Lambda Node.js Highlight integration.
Use the Node Highlight SDK in your response handler.
import type { APIGatewayEvent } from 'aws-lambda'
import { H, Handlers } from '@highlight-run/node'

// setup console log recording
H.init({ projectID: '<YOUR_PROJECT_ID>' })
// wrap your lambda with an error handler
export const handler = Handlers.serverlessFunction(
  (event?: APIGatewayEvent) => {
    console.log('hello, world!', {queryString: event?.queryStringParameters});
    return {statusCode: 200};
  },
  {
		projectID: '<YOUR_PROJECT_ID>',
		serviceName: 'my-lambda-function',
		serviceVersion: 'git-sha',
		environment: 'production',
	},
)
Verify that your SDK is reporting errors.
You'll want to throw an exception in one of your AWS Lambda handlers. Access the API handler and make sure the error shows up in Highlight.
Verify your backend logs are being recorded.
Visit the highlight logs portal and check that backend logs are coming in.
Verify your backend traces are being recorded.
Visit the highlight traces portal and check that backend traces are coming in.